My Google Analytics “goal” for the last three weeks has been to test the effectiveness of a web app I built (wine-time) by tracking clicks on the app’s main button, the search button. I decided to use this click event as my metric of success because If users aren’t clicking this button to render a customizable list of recommended wines then they’re not using the app for its intended purpose – for this reason it was an obvious choice as the goal for testing the app.
Google Analytics goal tracking – set up
My web app was created in Vue.js, which made setting up my Google Analytics goal slightly different than configuring a goal for a vanilla JS, HTML and CSS page. I was fortunate to find an excellent resource that helped me through the process. Article on tips and tricks of vue-analytics can be found here.
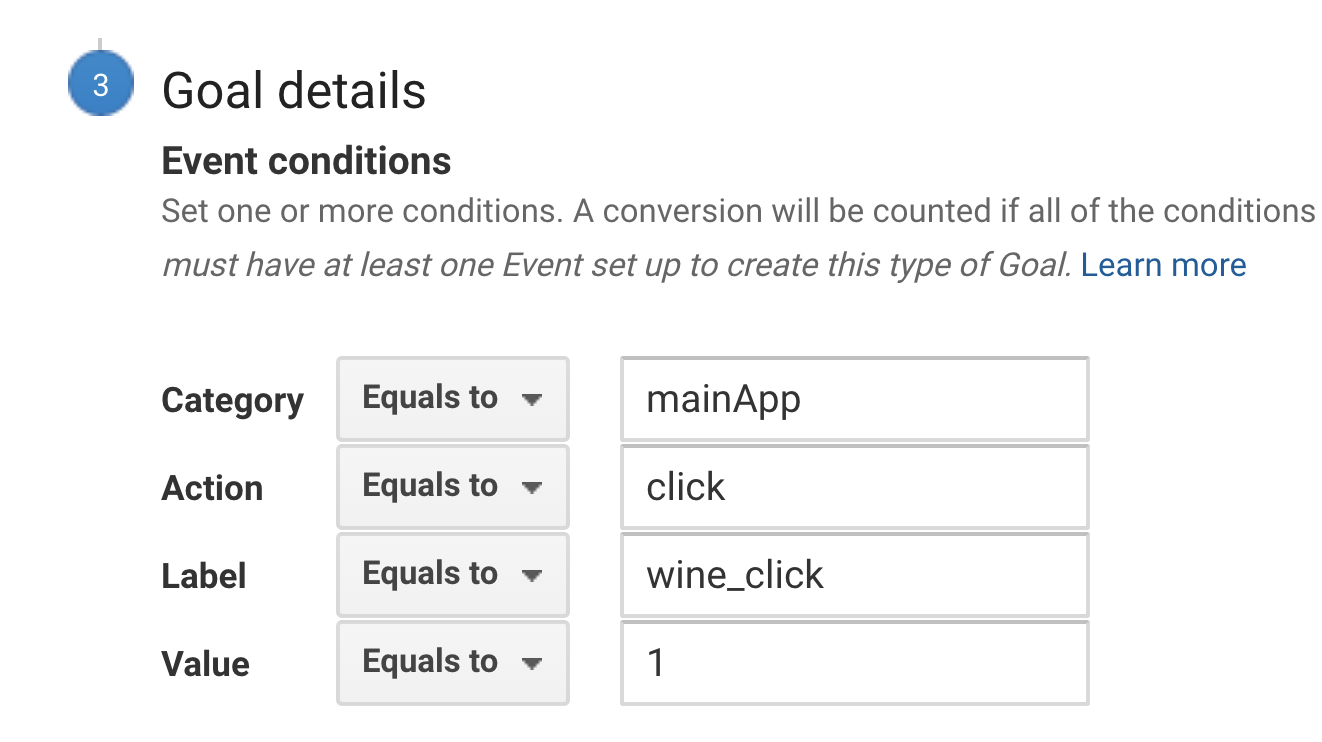
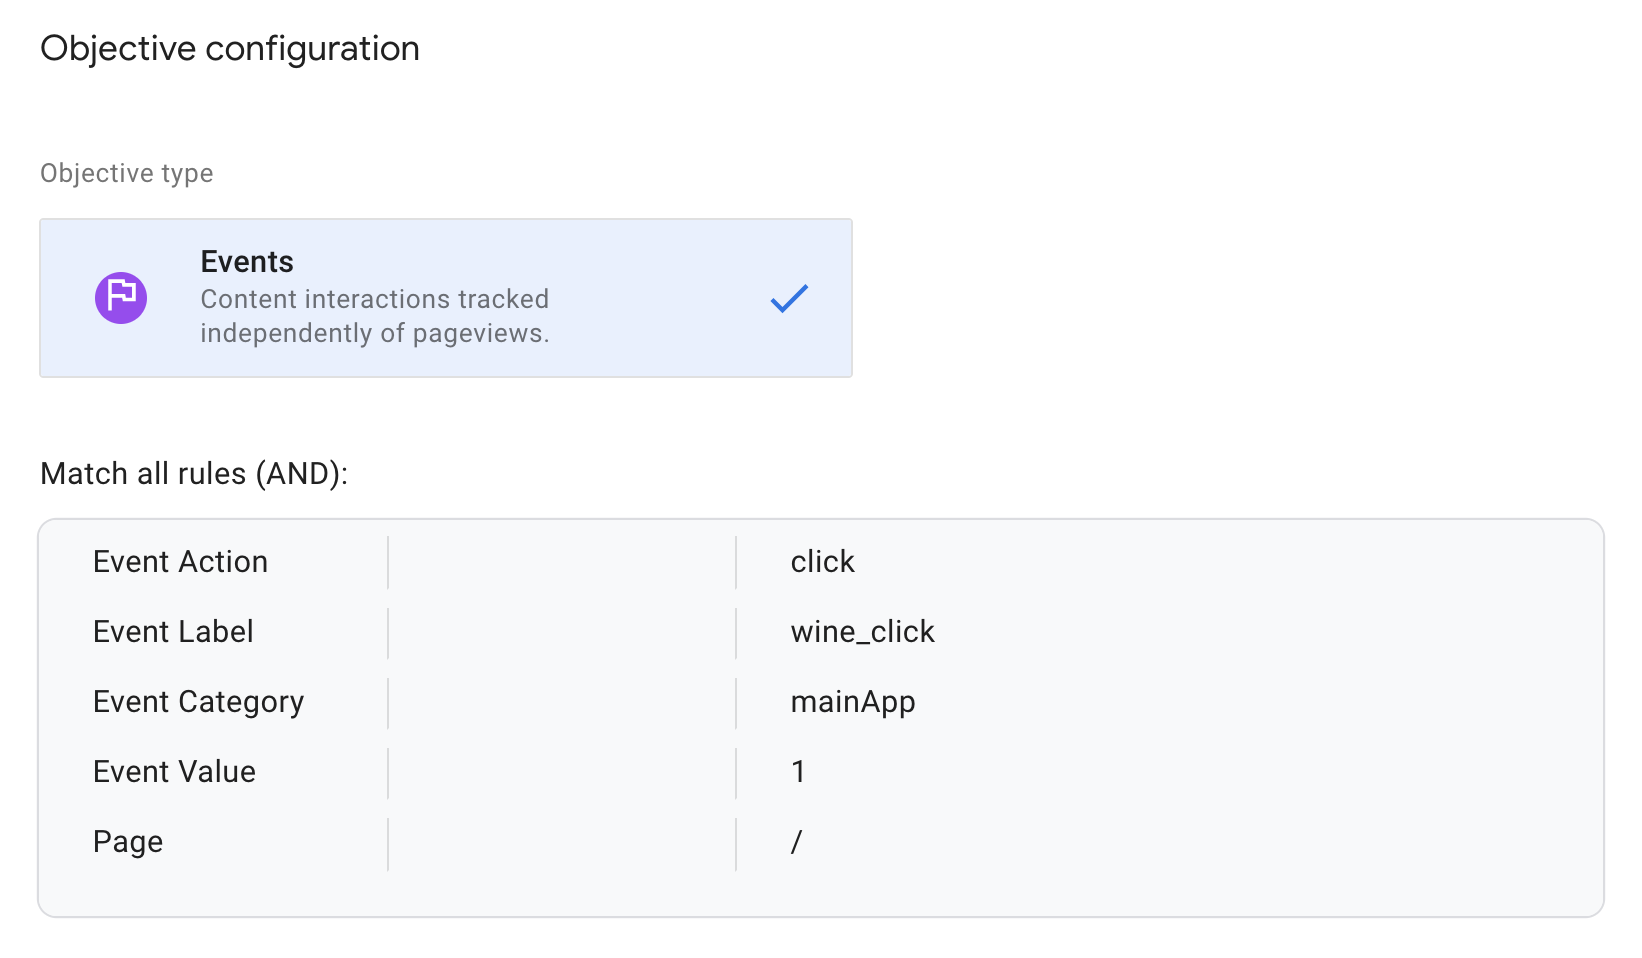
After installing vue-analytics and adding the import statement to my main.js file, as well as my unique Google Analytics site id number, I opened the vue document that included the goal I wanted to test, in my case the ‘search’ button. In the methods section of this template, I created a new method named ‘googleClick’ which included the same exact parameters I set up for the event in the Google Analytics UI.
 methods: {
  googleClick(){
        this.$ga.event({
            eventCategory:'mainApp',
            eventAction:'click',
            eventLabel:'wine_click',
            eventValue: 1
        })
    }
}
To finish, I added the event listener that triggers my ‘googleClick’ function, which updates my Google Analytics data when the search button is clicked.
A/B test experiment
To elaborate on my original “goal experiment” and to gather even more refined data I used Google Optimize to set up an A/B test (a technique which tests two versions of an app or website to determine which version is more successful based on the comparison of data).
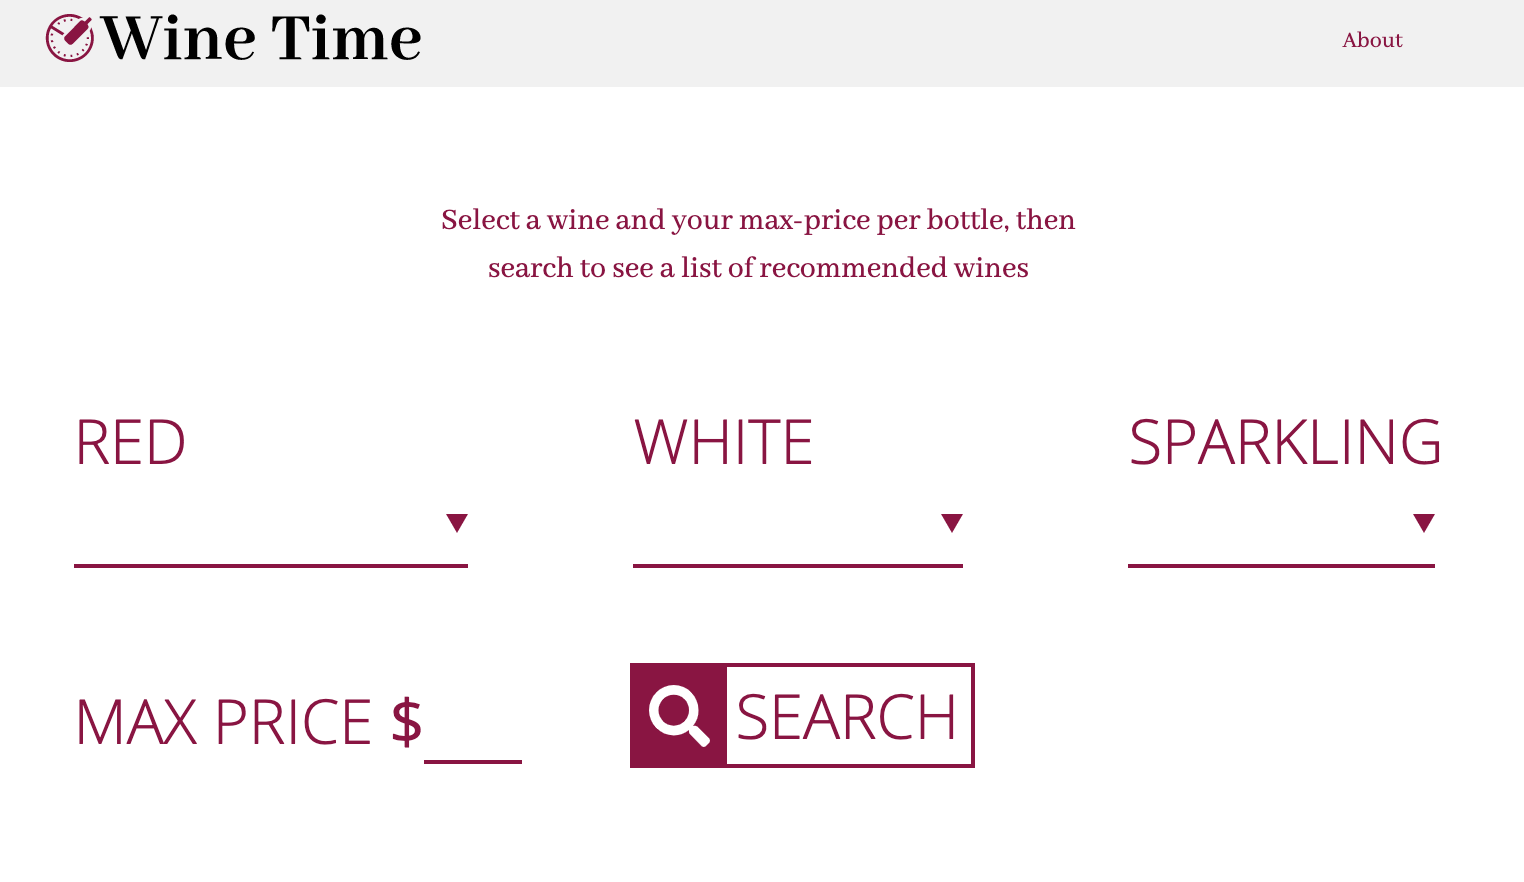
Before setting up my Google Optimize A/B test I considered which type of variant could produce the most interesting data. After analyzing the app I realized that it may be slightly confusing for a new user to understand how it works. Although I prefer simplicity, I also want users to understand how to use this app, so I wrote a short introduction on the homepage that provides instructions on how to use it. The message reads, “Select a wine and your max-price per bottle, then search to see a list of recommended wines.”
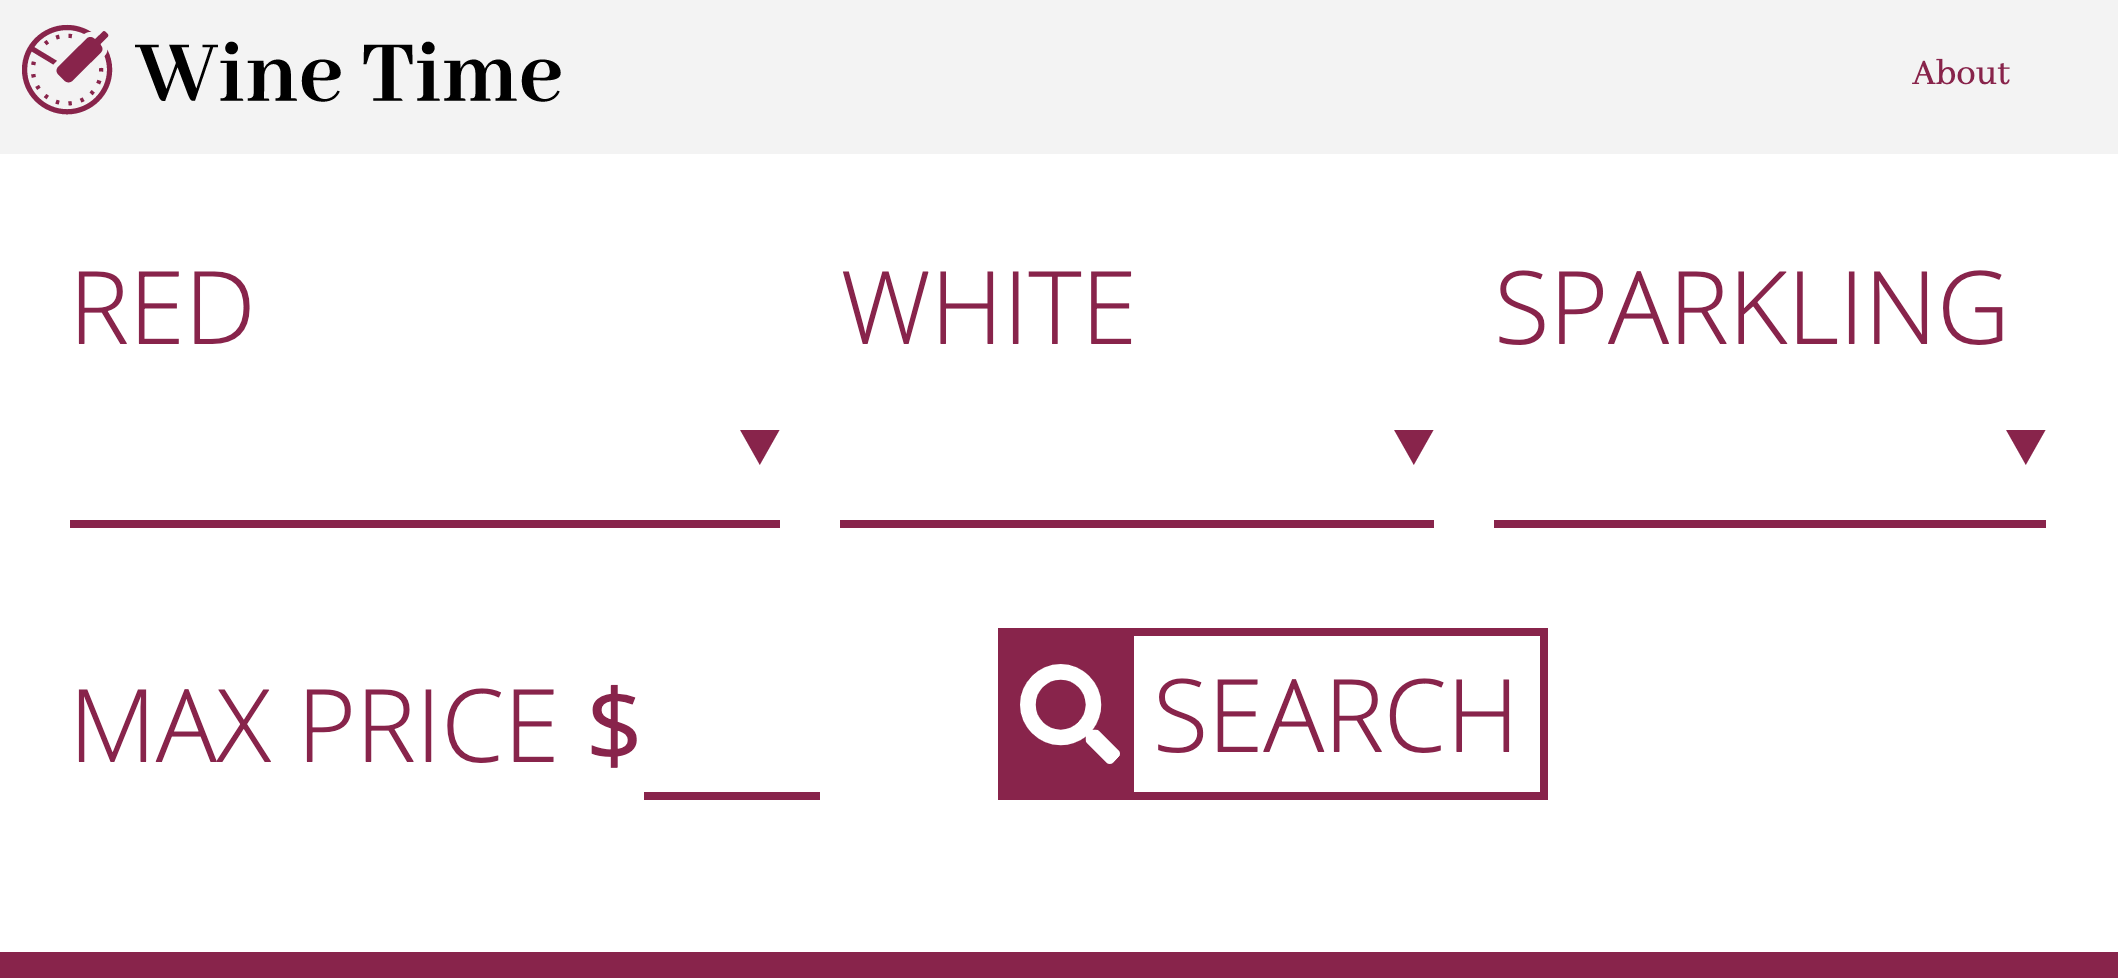
Since I wasn’t 100% sure of this change, I thought it would be an excellent source for an A/B test. From one perspective, adding more context and instructions to an app typically makes it easier to use, however, adding more text creates more visual clutter and could potentially confuse users as well. So, for my variant I decided to delete the instructions I had added to see if having them or not having them made a difference to my user statistics.
Setting up the A/B test
My first step in setting up Google Optimize (A/B test) was to link to my Google Analytics account with my Google Analytics ID. After that I “created a new experience,” by adding the url of the site/app I wanted to test and then chose “A/B” as the type of test that I would like to conduct. At this point I added a new variant by clicking “add variant.” The default settings for the A/B test takes 100% of my users and shows 50% of them the original version and the other 50% the new variant version.
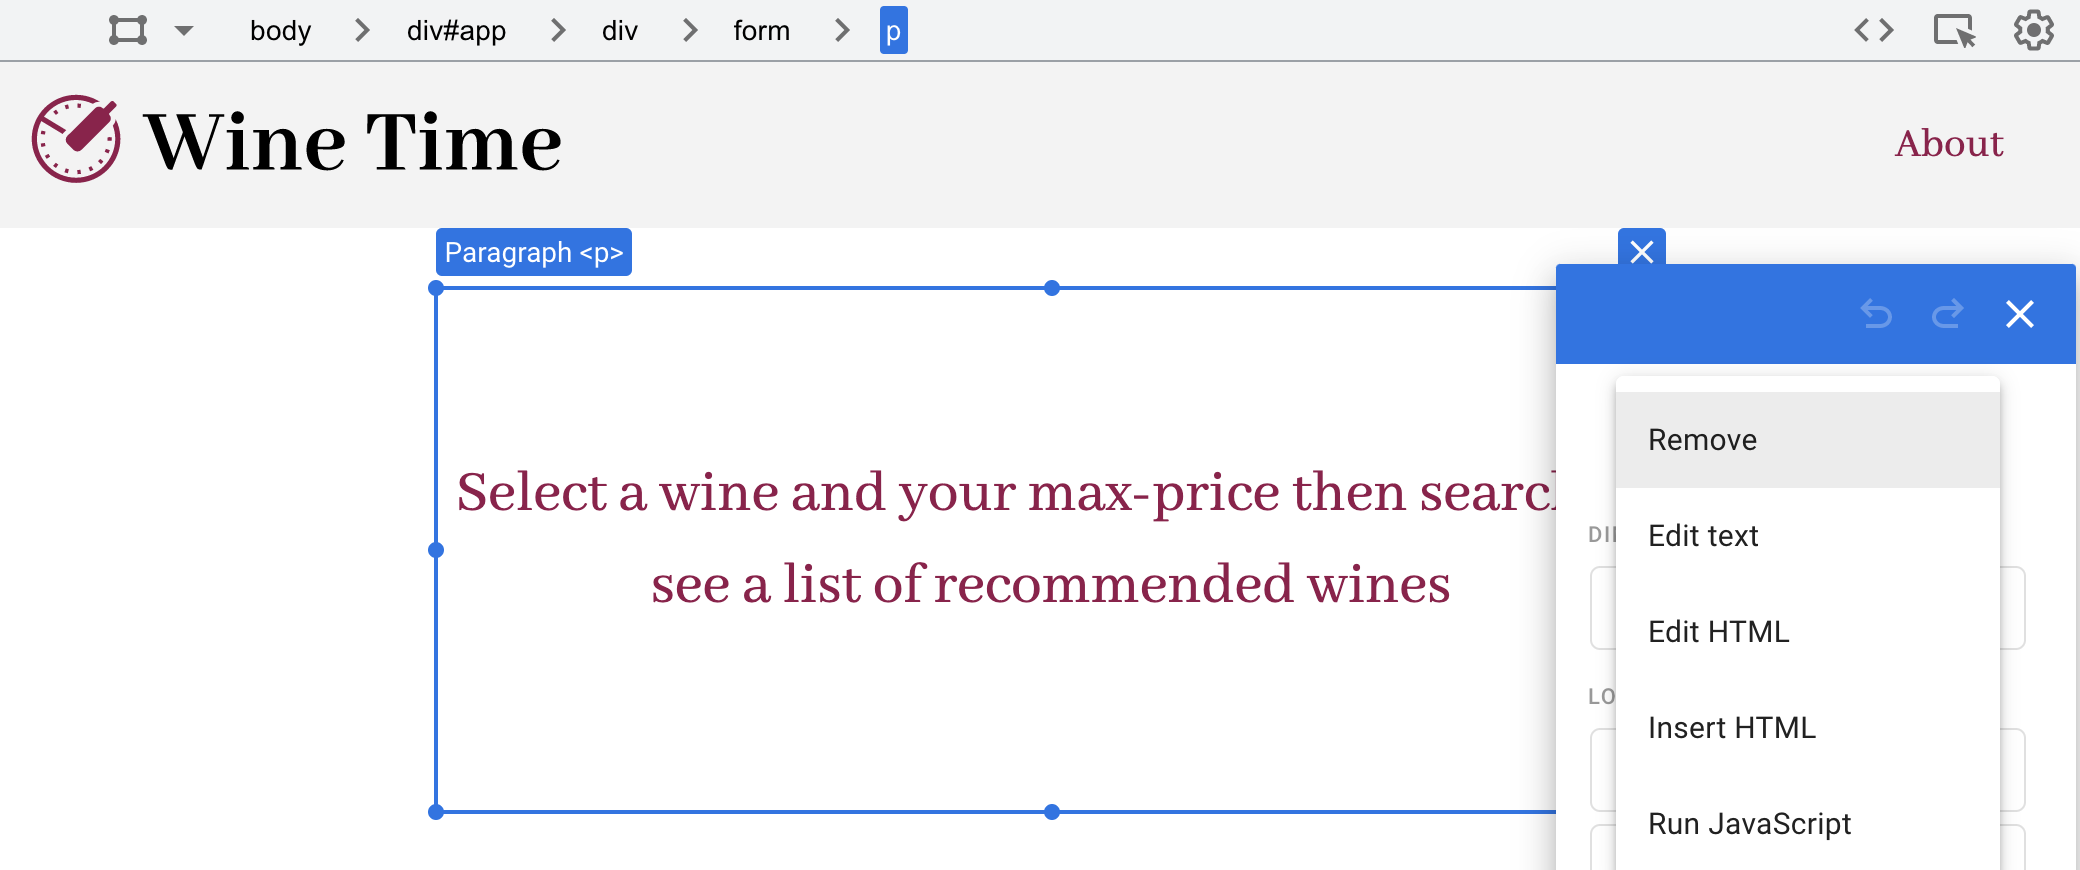
Since I had already changed my app to include instructions, this became my “original” variant. To edit the new variant I named “deleted instructions for app”, I clicked the “edit” button next to it, which then took me to a wysiwyg editor where I deleted the container that included the text instructions for the app.
Once this process was complete I set up an objective for the users so I could measure the success of each version. For my objective I used the click event (search button) that I had used as my original goal for determining the effectiveness of the app.
The Data
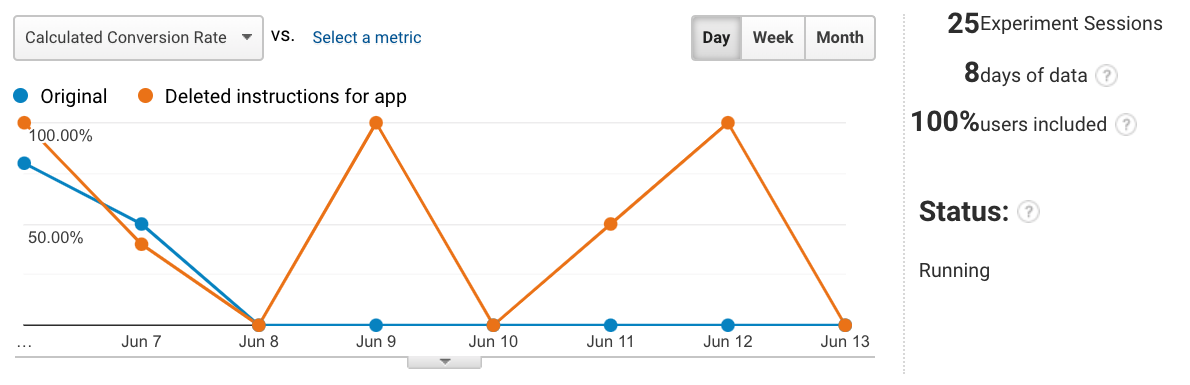
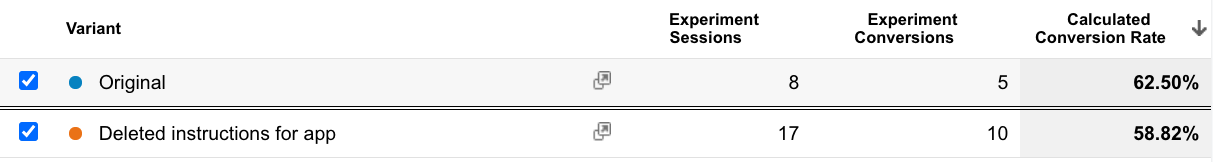
About a week and a half into my A/B test my results are very similar to the data that I collected on day two. Two days into data collection, I had had seven views and five successful conversions (when users clicked the search button) for variant 1 (version with the instructions) and seven views and four conversions for variant 2 (version without instructions). On day eight I had eight views and five successful conversions for variant 1 and 17 views for variant 2 with 10 conversions.
The calculated conversion rate changed moderately during the six days between collecting the data. Variant 1 went from a 71% conversion rate to a 62% conversion rate, whereas variant 2 went from a 57% conversion rate to a 59% conversion rate.
Even with the data suggesting that the conversion rate of variant 1 is dropping and the conversion rate of version 2 is rising, at the moment it’s not extreme enough to convince me that I should use version 2. If they continue to have a similar conversion rate I believe that version 1 (with the added instructions) is the correct choice, as there is rarely a drawback to adding context and clarity to an application interface.
For the first time while studying usability, I’m not surprised by the data collected from this experiment. Which actually says a lot about usability testing. If done correctly, more often than not, I end up surprised by the data and convinced to make an adjustment to a feature that I made based on my own assumption of “what most people like.” From my usability testing, I'm consistently learning one important lesson, my assumptions are mostly incorrect. I really have no idea what “most people like,” so experimenting with usability tests and Google analytics is the most effective way of solving U/I and U/X problems.
Ultimately, I think this may be a unique circumstance because this app is so simple that it doesn’t necessarily need added instructions, which is why both variants have a similar conversion rate.
Next Steps
My next steps in developing this web app would be to consider how to make the app’s function instantly perceivable – without a millisecond of extra thought. If designed properly there would be no learning curve at all. How would it be possible to do this? Testing and then more testing. I think making subtle changes and using an A/B test to collect data would be an excellent way to move forward, as well as traditional usability testing. I also think it’s important to continue to run usability tests throughout the lifecycle of all web projects. Unlike the print world, websites can constantly evolve and so do the tastes of the users, so something that works this year may feel out of date next year.
Conclusion
I’ve mentioned this before, but Google Analytics’ tools have reinforced my belief that usability testing is an excellent exercise in letting go of your preconceived notions about users. From my own perspective, it’s incredibly difficult to design the physical look and logical flow of an app or website while being objective. At its core, any creative process is subjective. It’s not wrong to design and develop for yourself first, but at some juncture in the project’s creation there should be an outside perspective and Google Analytics is a great place to start. If collected and reviewed without bias, Google Analytics gives the web developer pure, objective data. To me, there isn’t anything in user science that is more valuable than objective data, because it allows the developer to create experiences for every user as opposed to one.